前言

记录一次线上出现的API请求偶现严重慢请求的问题解决过程

需要了解的词

  • keep-alive
    HTTP keep-alive,又称为HTTP持久连接(HTTP persistent connection)或HTTP连接复用(HTTP connection reuse),指使用同一个TCP连接来发送和接收多个HTTP请求/应答,而不是为每一个新的请求/应答打开新的连接的方法
    • 较少的CPU和内存的使用(由于同时打开的连接的减少了)
    • 允许请求和应答的HTTP管线化
    • 降低拥塞控制TCP连接减少了)
    • 减少了后续请求的延迟(无需再进行握手
    • 报告错误无需关闭TCP连接
  • gomonkey
    通过更改汇编机器码的方式在golang中实现monkey patch,原理可见这篇文章

现象

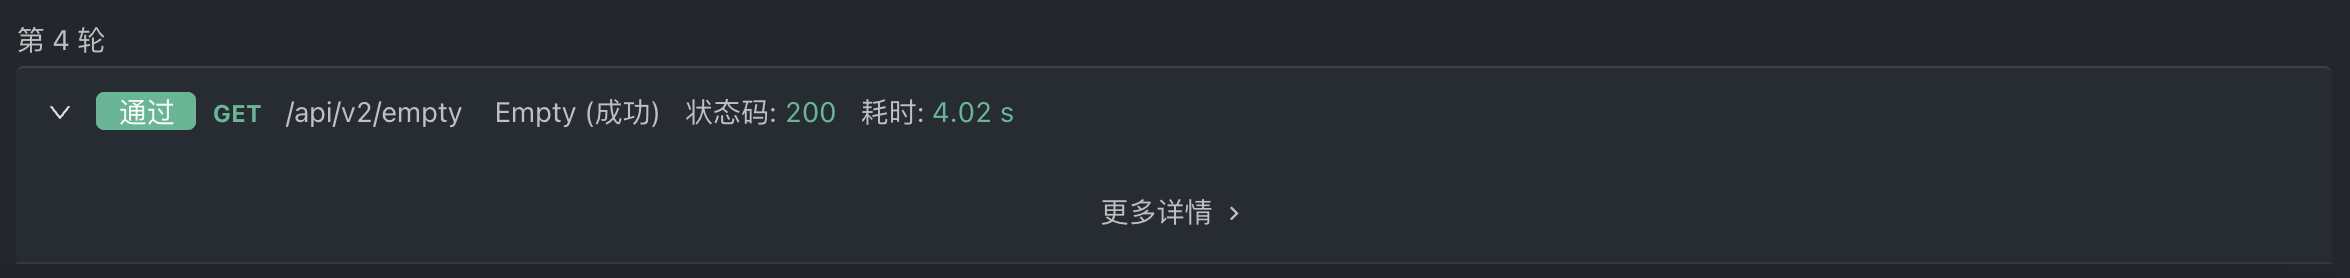
具体现象为在前端页面中的前几次API请求中,大概率出现一次慢请求(4s左右)

通过Apifox进行接口压力测试也能轻易复现问题,且在一轮3600次的请求中,慢请求基本只出现在前几次请求中

image-20221028113005588

排查思路

整体思路为先由API服务从请求尾端向前查,同步可从客户端往后查

监控

首先看一看经过初步的接口压力测试,我们的接口耗时监控的情况:

image-20221028113245721

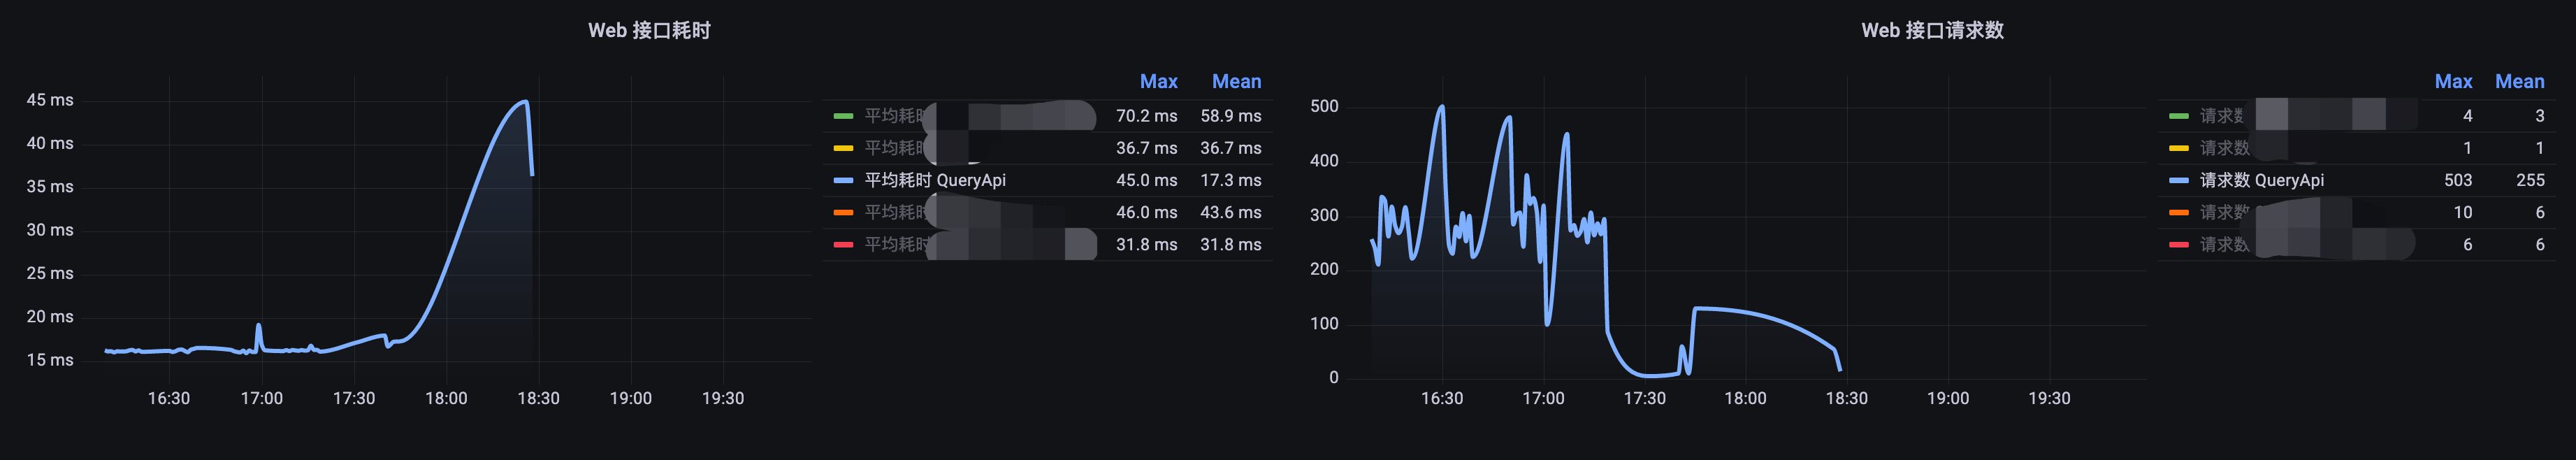
完全没有异常的慢请求,最大耗时也仅在45ms

pprof

考虑到监控埋点的范围有限,再使用gin-pprof(注册pprof的HTTP接口到路由中)尝试抓取profile数据进一步观察:

配置pprof

1
2
router := gin.Default()
pprof.Register(router)

抓取profile数据:

1
2
3
kubectl port-forward xxxxxxx-api xxx:xxx
curl http://localhost:31888/debug/pprof/profile\?seconds\=30 -o profile
go tool pprof -http=:6061 ./profile

image-20221028144657524

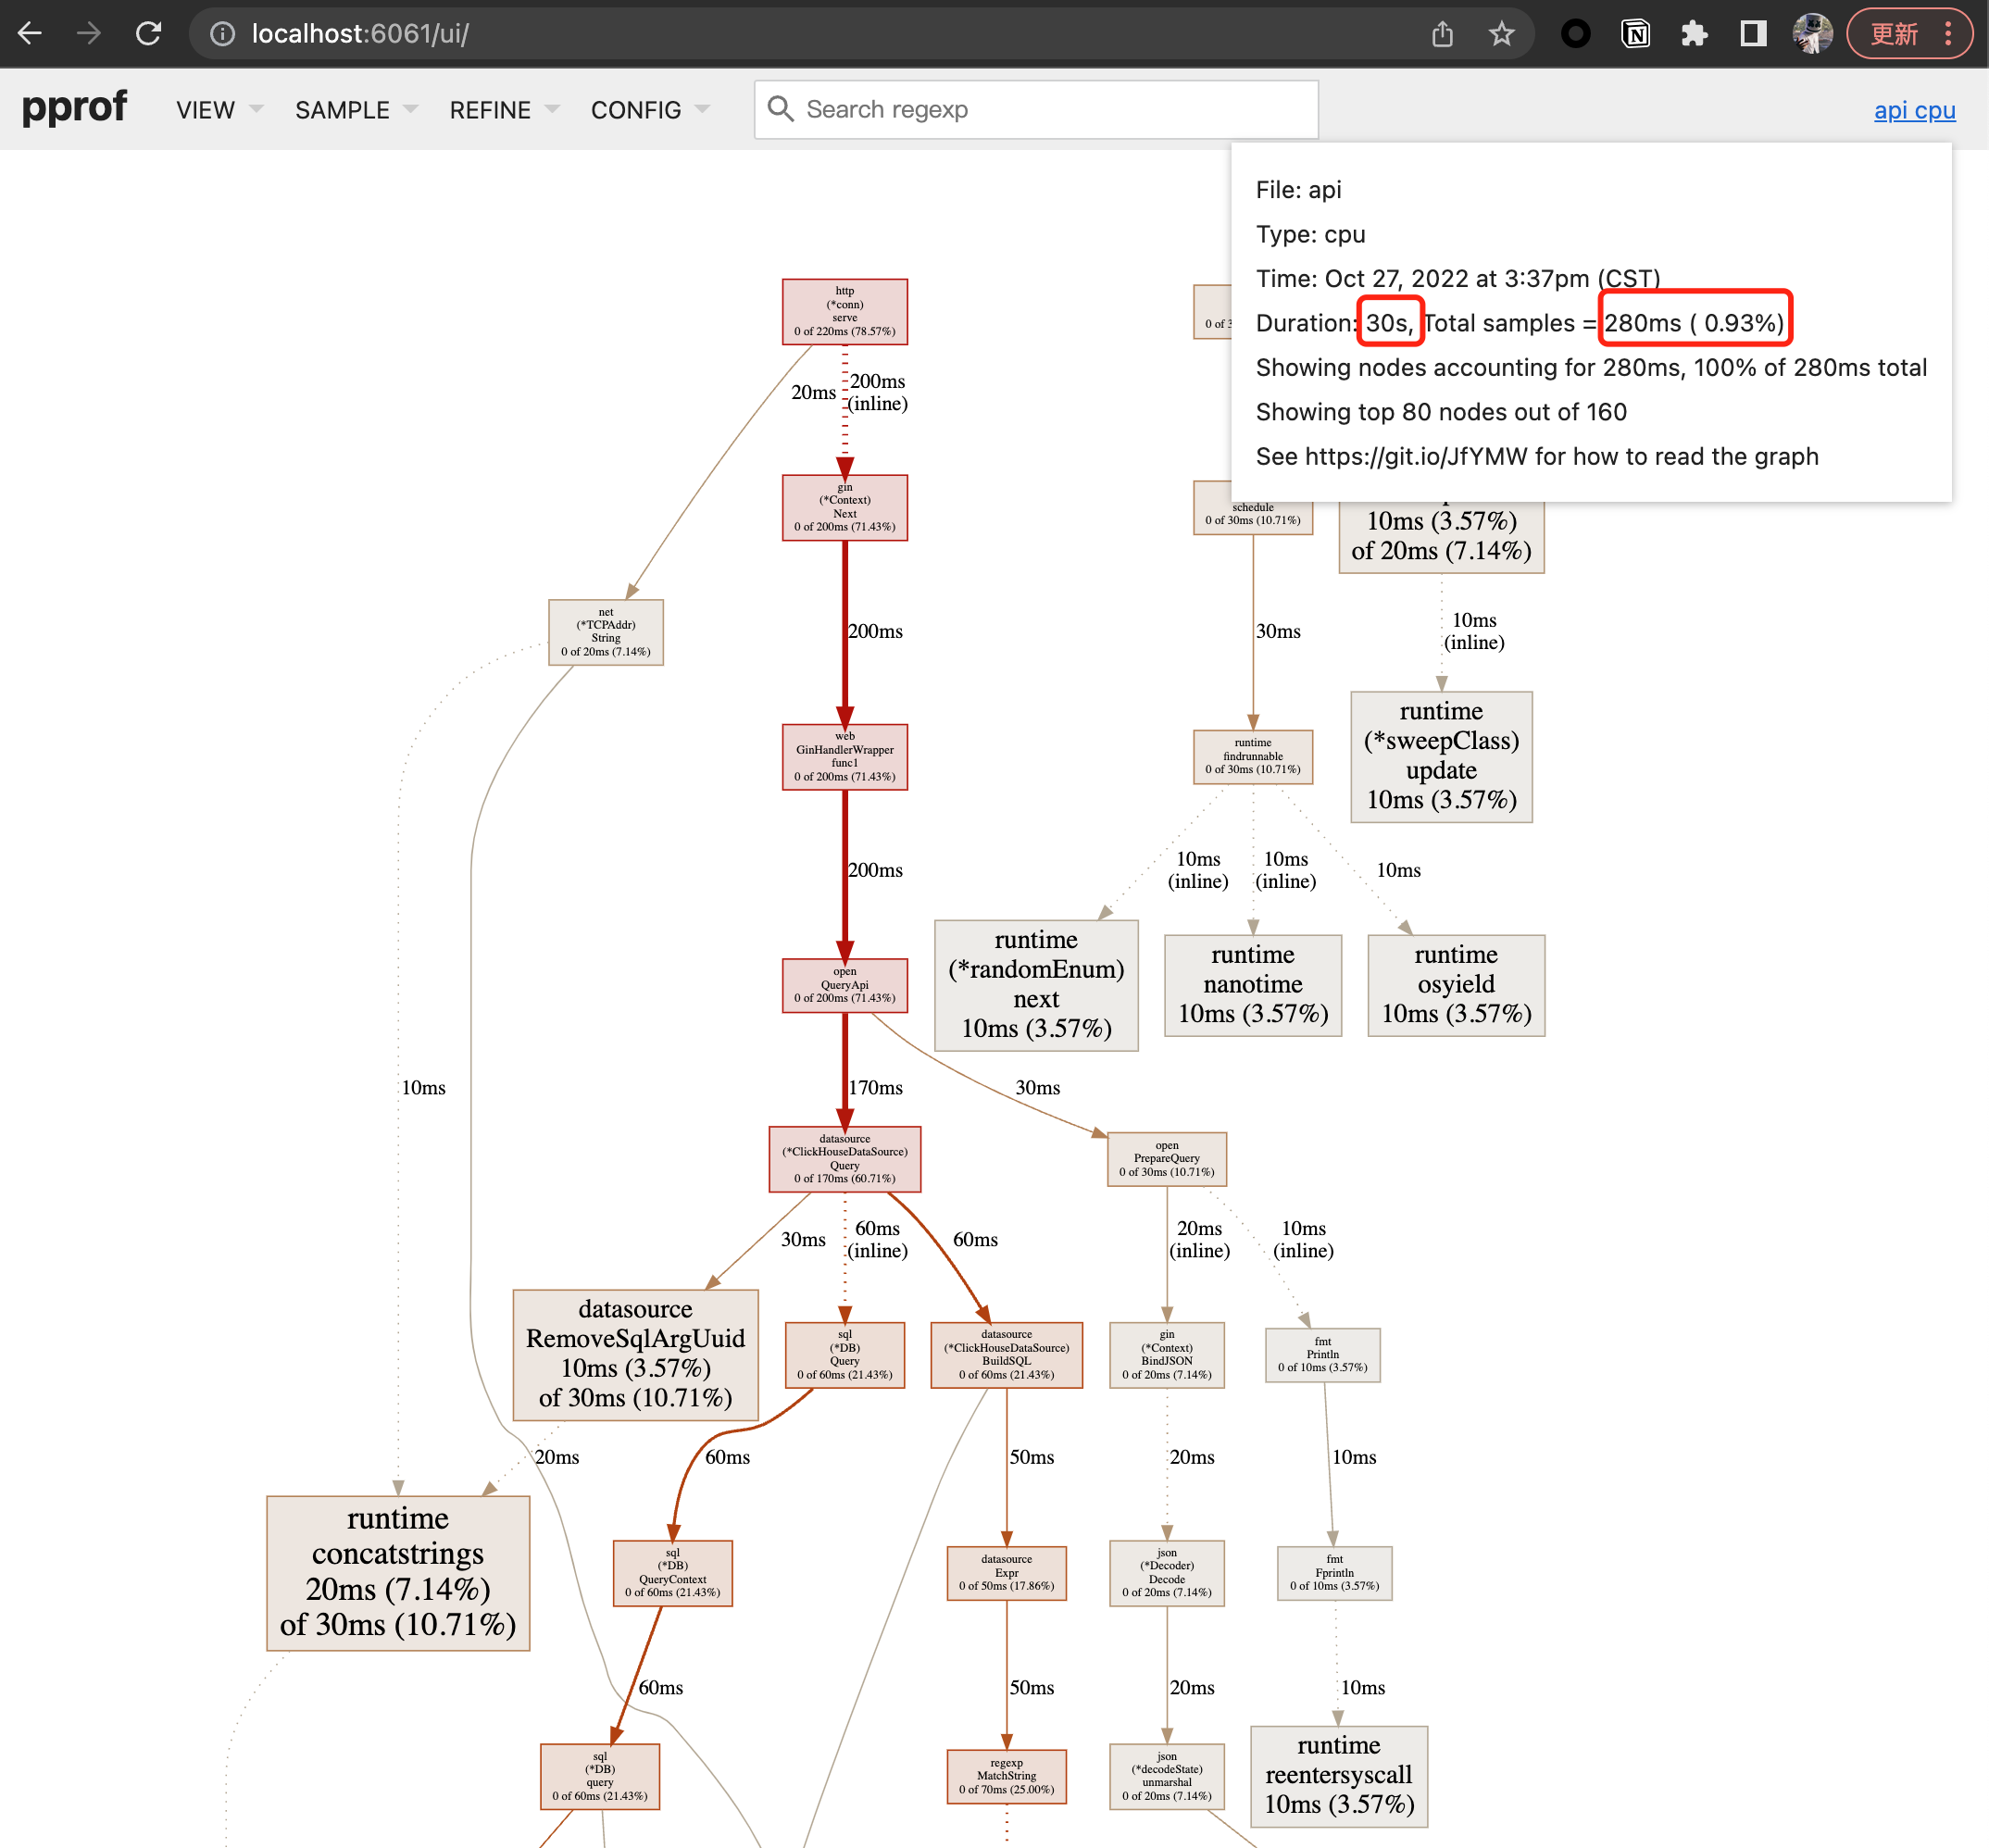
可以看到最后整个的采样率非常低,考虑到可能是pprof采样频率的原因(见这篇讨论),重新调整了cpu profile采样频率

image-20221028152433634

但依旧无法提升我们的采样率,这里暂时卡住了排查进度

trace确认

通过pprof的交互client获取明确的调用链:

1
2
3
4
5
6
7
8
9
10
11
12
13
14
15
16
17
18
19
20
21
22
23
24
25
26
27
28
29
30
31
32
33
34
35
36
37
38
39
40
41
42
43
44
45
go tool pprof http://localhost:31888/.../debug/pprof/goroutine
traces
-----------+-------------------------------------------------------
5 runtime.gopark
runtime.selectgo
database/sql.(*DB).connectionOpener
-----------+-------------------------------------------------------
...
-----------+-------------------------------------------------------
1 runtime/pprof.runtime_goroutineProfileWithLabels
runtime/pprof.writeRuntimeProfile
runtime/pprof.writeGoroutine
runtime/pprof.(*Profile).WriteTo
net/http/pprof.handler.ServeHTTP
net/http.HandlerFunc.ServeHTTP (inline)
github.com/gin-contrib/pprof.pprofHandler.func1
github.com/gin-gonic/gin.(*Context).Next (inline)
github.com/gin-gonic/gin.CustomRecoveryWithWriter.func1
github.com/gin-gonic/gin.(*Context).Next (inline)
github.com/gin-gonic/gin.LoggerWithConfig.func1
github.com/gin-gonic/gin.(*Context).Next (inline)
github.com/gin-gonic/gin.(*Engine).handleHTTPRequest
github.com/gin-gonic/gin.(*Engine).ServeHTTP
net/http.serverHandler.ServeHTTP
net/http.(*conn).serve
-----------+-------------------------------------------------------
...
-----------+-------------------------------------------------------
1 runtime.gopark
runtime.netpollblock
internal/poll.runtime_pollWait
internal/poll.(*pollDesc).wait
internal/poll.(*pollDesc).waitRead
internal/poll.(*FD).Accept
net.(*netFD).accept
net.(*TCPListener).accept
net.(*TCPListener).Accept
net/http.(*Server).Serve
net/http.(*Server).ListenAndServe
net/http.ListenAndServe
github.com/gin-gonic/gin.(*Engine).Run
tdemapi/pkg/server.Gin
main.main
runtime.main
-----------+-------------------------------------------------------

可以看到业务handler前,栈底的主要调用链为:

1
2
3
graph TD
A("net/http.(*conn).serve") -->|call| B("net/http.serverHandler.ServeHTTP")
B -.->|interface call| C("github.com/gin-gonic/gin.(*Engine).ServeHTTP")

其中gin.(*Engine).ServeHTTP为底层的http调用gin实现的http.Handler接口中的ServeHTTP(ResponseWriter, *Request)方法,再往后就会走到我们的业务handler

concurrency排查

根据以往开发fasthttp web service的经验,偶现慢请求还可能是concurrency设置的不够(golang大部分web框架都是一条请求启动一个协程,像fasthttp中就有一个concurrency的配置来控制最大并发数)

image-20221028172920767

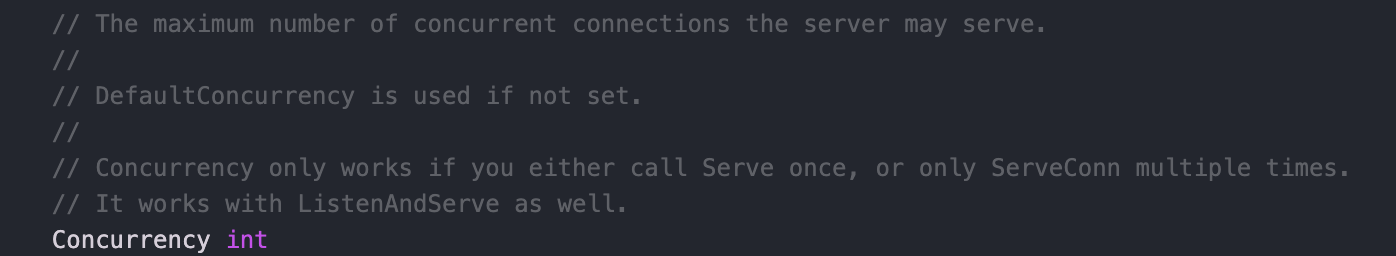
经过一些文档查询(详见这篇),我确认了gin框架没有类似fasthttp的明文配置concurrency,要在应用层控制其最大并发数一般是通过中间件实现的:

1
2
3
4
5
6
7
8
9
10
11
12
13
14
15
16
17
18
19
func LimitMiddleware() gin.HandlerFunc {
// create a buffered channel with 2000 spaces
semaphore := make(chan bool, 2000)


return func (c *gin.Context) {
select {
case semaphore <- true: // Try putting a new val into our semaphore
// Ok, managed to get a space in queue. execute the handler
c.Next()

// Don't forget to release a handle
<-semaphore
default:
// Buffer full, so drop the connection. Return whatever status you want here
return
}
}
}

而我们的API服务并没有类似的中间件配置,那么这里就只有可能被golang自己的GOMAXPROCS变量限制到最大并发数了(参考经典文章Concurrency, Goroutines and GOMAXPROCS

golang中不只是有我们熟知的goroutine,在其之上还有Processor(P), Machine(M)的概念,M 是系统线程,是负责真正执行 goroutines 的系统线程。 P 是类似于 CPU 核心的概念,其用来控制并发的 M 数量,下面的两段话很好的解释了这三者的关系:

企业微信截图_b82c5fa9-376a-496f-9474-006090d78fa9

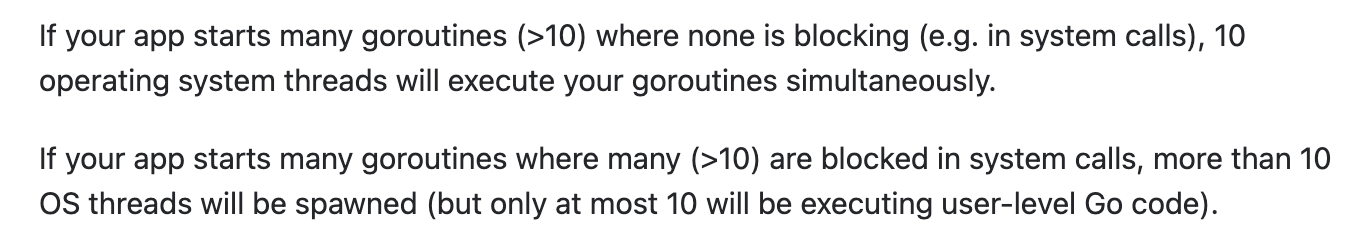
但我们的API服务中并没有更改过GOMAXPROCS变量,且pod的负载也持续很低,到这里并发问题也可以排除了

Gin框架耗时排查

基于上面拿到的的trace,我们可以知道在我们的业务handler前就是gin.(*Engine).ServeHTTP,通过gomonkeygin.(*Engine).ServeHTTP进行monkey patch,增加时间戳输出打点

1
2
3
4
5
6
7
8
9
10
11
12
13
14
15
16
router := gin.Default()
patch := gomonkey.ApplyMethod(reflect.TypeOf(router), "ServeHTTP", func(engine *gin.Engine, w http.ResponseWriter, req *http.Request) {
// 避免无限递归
cookie, err := req.Cookie("isCalled")
if err == http.ErrNoCookie {
req.AddCookie(&http.Cookie{Name: "isCalled", Value: "yes"})
} else {
log.Printf("cookie 'isCalled': %s", cookie.Value)
return
}

log.Printf("gin ServeHTTP "+" start timestamp "+" %v", time.Now())
engine.ServeHTTP(w, req)
log.Printf("gin ServeHTTP "+" stop timestamp "+" %v", time.Now())
})
defer patch.Reset()

完成后重新尝试触发慢请求,可以看到慢请求耗时在gin.(*Engine).ServeHTTP前产生:
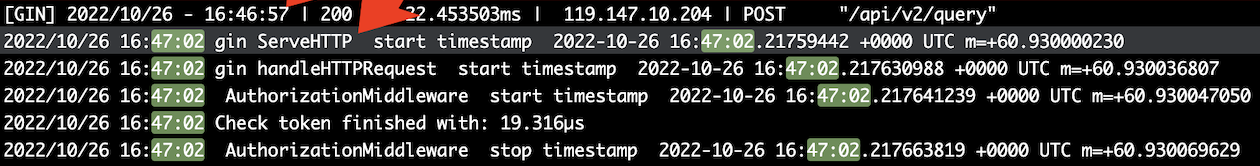
image-20221031011809250

16:46:57时就已经输出了请求的部分信息,但由于url,源ip等信息本身就在http包体的前部,可能后续的网络包还在网关等位置出现了问题,这里我们也不能断定是服务端的问题

客户端排查

做完以上的服务端排查,基本上可以确认服务端没有问题了(除非继续深入到golang原生http库,但本身出问题的概率就不大);所以接下来我们反向从客户端开始排查问题,首先确认是否为客户端请求没有使用持久连接导致的偶现慢请求,这里我们使用go-wrk这个工具来进行压力测试
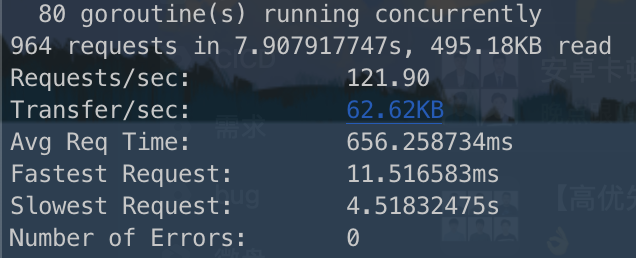
keep-alive

1
go-wrk -T 5000 -c 80 -d 5 -H x-token:T0E6OnNtaXRoZGVuZ3x8MTY2NzM1NjgyMTEwMDM1ODM2YzA2YWExOWZhNzE4YmM2NDZjYjNiZThlMGEzMjNhMjg= https://pub1.sngapm.qq.com/api/v2/public/hello

image-20221027213611943

no keep-alive

1
go-wrk -no-ka -T 5000 -c 80 -d 5 -H x-token:T0E6OnNtaXRoZGVuZ3x8MTY2NzM1NjgyMTEwMDM1ODM2YzA2YWExOWZhNzE4YmM2NDZjYjNiZThlMGEzMjNhMjg= https://pub1.sngapm.qq.com/api/v2/public/hello

image-20221027213708893

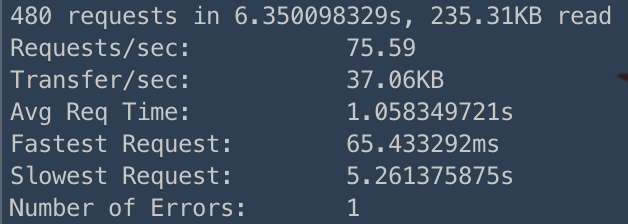
虽然不重用连接会慢,但都有超长请求,不能说明是客户端没有重用连接导致的

LB排查

在确保客户端请求正确性的前提下依旧能复现慢请求,接下来就要往LB去排查了,通过服务端日志输出的ip地址来确认负载均衡指向的机器,很快我们发现慢请求都出现在同一台用于负载均衡的服务器上,去除该问题节点后请求恢复了正常(后续找相关同学确认是LB机器重试未响应的超时时间),耗时稳定在50ms左右

总结

整体的排查思路没有错,面对网络请求问题从服务端、客户端两头来排查;但在一面难以继续深入排查时需要尽快调转车头转向反向链路进行排查,往往能起到事半功倍的效果